Vanish App
A web application made with HTML and JavaScript on the frontend and backend powered by Firebase. You can sign in with your google account, make posts, share your user id with others so they can follow and see your posts. Posts will 'vanish' after a duration set by the poster.

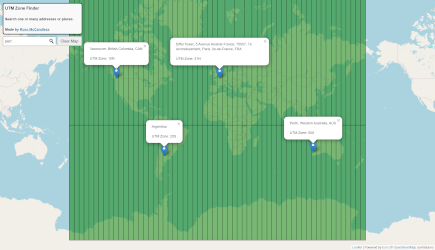
UTM Zone Finder
Find one to many UTM Zones based on your place or address searches. Uses Esri's Leaflet Geocoder + Turf.js to find intersecting polygon in my UTMZone.geojson.
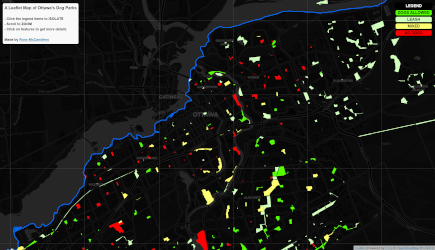
Ottawa Dog Parks
A Leaflet web map of Ottawa's Dog parks that lets you filter the results by using the legend. Data source: open.ottawa.ca.
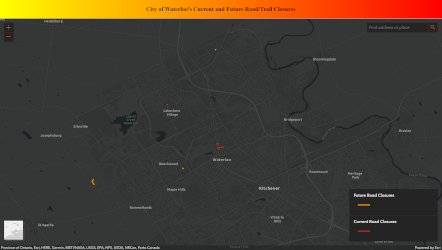
WATFindClosures
A web map made with Esri's JavaScript API that shows current and future road/trail closures within the City of Waterloo. Data source: data.waterloo.ca.
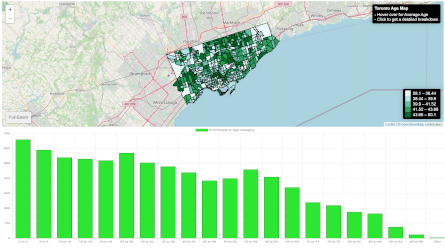
Toronto Ages Map
A Leaflet web map of Toronto's Census Tracts that uses chart.js to plot 2016 Census age data. Data source: statcan.gc.ca.
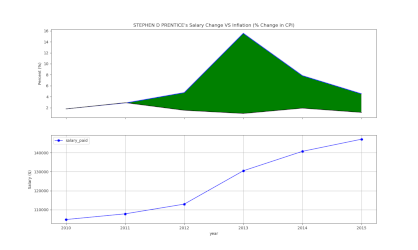
WATinflation
A Python based GUI that plots University of Waterloo faculty and staff salaries as well as their change in salary compared with inflation from 1996 to 2019. WATInflation.exe runs the tool. But if you have Python installed you can run the WATInflation.py file instead. Data source: ontario.ca.
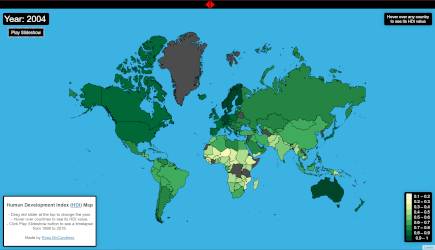
Human Development Index Map
This map shows the Human Development Index (HDI) values for each country from 1990
to 2019.
Hit the Play Slideshow button to see a timelapse. Data source: United
Nations.
GRT Unofficial Tracker
A Leaflet web map which lets you view real-time bus locations for any Grand River
Transit route. Data source: grt.ca.
DEPRECIATED. Free use of Heroku ended late 2022 which
has broken this project.